



Current implementation - syscall abstractions
I refactored my approach to test my malloc by just mocking syscalls under testing conditions to get rid of dynamic linking altogether.

This page documents how allocator callsites were identified during runtime, and how we distinguished internal allocator calls from those originating in foreign shared libraries. This is a part of dynamic linking investigation series.
Who is calling malloc inside the process, and from where?
Answering this was necessary to validate whether statically linking allocator symbols truly rerouted all allocation activity through our implementation.
To observe allocator usage, we recorded the return address each time one of our allocator entry points (malloc, free, calloc, realloc) was called.
This was implemented using:
__builtin_return_address(0)
On AArch64, this corresponds to the value stored in the link register (LR) by the bl (branch-with-link) instruction. When a function is called, bl records the caller’s next instruction address in lr, which becomes the return address.
When our allocator is entered, lr therefore points to the exact instruction in the caller that invoked it.
__builtin_return_address is only well-defined under constrained conditions:
For external shared libraries, PIC code, PLT entries, or sanitizer runtimes, the value is implementation-defined. Despite this, it is sufficiently stable for investigative debugging and callsite classification.
When TRACK_RET_ADDR is enabled at compile time, each allocator call records:
These records are stored in a fixed-size stack-allocated array to avoid recursive allocations during logging.
If allocator counters exceed expected values during a test, the recorded callsites are printed to diagnose unexpected activity.
      [MM_RET_ADDR] (0) size=73728 ret_addr=0xffffb9aa4f2c, free: 0
      [MM_RET_ADDR] (1) size=240 ret_addr=0xaaaad4733eec, free: 0
      [MM_RET_ADDR] (2) size=480 ret_addr=0xffffb9eaf990, free: 0
---------
Test test_align...                              [ OK ]
      [MM_RET_ADDR] (0) size=73728 ret_addr=0xffffb9aa4f2c, free: 0
      [MM_RET_ADDR] (1) size=240 ret_addr=0xaaaad4733eec, free: 0
      [MM_RET_ADDR] (2) size=480 ret_addr=0xffffb9eaf990, free: 0
      [MM_RET_ADDR] (3) size=1024 ret_addr=0xffffb9eaecc8, free: 0
---------
      [MM_RET_ADDR] (0) size=73728 ret_addr=0xffffb9aa4f2c, free: 0
      [MM_RET_ADDR] (1) size=240 ret_addr=0xaaaad4733eec, free: 0
      [MM_RET_ADDR] (2) size=480 ret_addr=0xffffb9eaf990, free: 0
---------
Test test_invalid_addr_outside_before_for_is_valid_addr...
      [MM_ASSERT] malloc_called_with_caller: actual=2 expected=1
      [MM_RET_ADDR] (0) size=73728 ret_addr=0xffffb9aa4f2c, free: 0
      [MM_RET_ADDR] (1) size=240 ret_addr=0xaaaad4733eec, free: 0
      [MM_RET_ADDR] (2) size=480 ret_addr=0xffffb9eaf990, free: 0
      [MM_RET_ADDR] (3) size=1024 ret_addr=0xffffb9eaecc8, free: 0
      [MM_RET_ADDR] (4) size=16 ret_addr=0xaaaad472f59c, free: 0
---------
test_malloc: tests/test_malloc.c:107: ensure_my_malloc_is_called: Assertion `(malloc_called) == ((1))' failed.
Note: The way we printed was at the moment formatted printing to stderr. In this case fprintf allocates as well. We later implement a non-allocating print helper to avoid this.
During test execution, two distinct address ranges appeared repeatedly in recorded return addresses:
0x0000aaaa...)0x0000ffff...)This immediately suggested multiple calling domains.
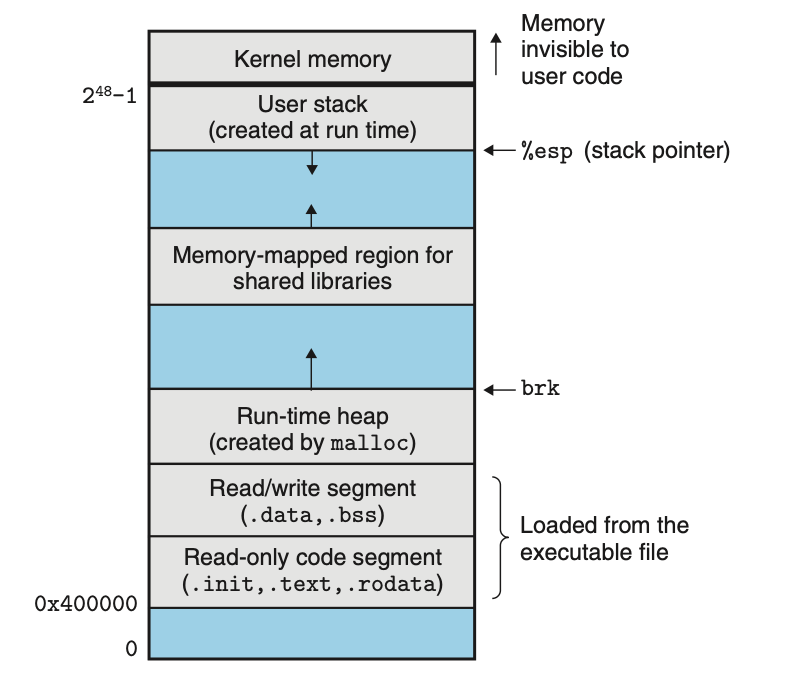
On 64-bit Linux (including AArch64), process virtual memory is typically divided as follows:
.text typically end up around 0x0000aaaa... on aarch64 (that’s what we saw earlier in ret_addr=0xaaaabed...)).With PIE(Position Independent Executable) and ASLR(Address Space Layout Randomization) enabled, absolute addresses vary, but relative regions remain consistent.
As a result:
0xaaaa... range correspond to calls originating from our test executable.0xffff... range correspond to calls originating from shared libraries.This distinction alone was sufficient to prove that foreign code paths were entering our allocator.
Two characteristic cases emerged:
When malloc is called from within our own code (e.g. via calloc), the recorded return address points to an instruction inside the executable’s .text section.
These calls are deterministic, expected, and usually part of allocator composition.
When malloc is called from a shared library (e.g. libstdc++ or libc), the return address lies inside the mapped range of that shared object.
This confirmed that:
malloc to our symbolThe exact mechanics of this resolution are explained in the ELF: GOT, PLT & Lazy Binding.
One complication encountered during tracing was recursive allocation during logging.
For example:
fprintf to print diagnostics caused additional allocationsTo mitigate this:
This ensured that observed allocator activity reflected genuine call paths rather than instrumentation artifacts.
By recording return addresses at allocator entry points, we were able to:
This laid the foundation for deeper inspection using a debugger, covered next in GDB malloc Call Tracing, and for understanding why this behavior differs across platforms.
I refactored my approach to test my malloc by just mocking syscalls under testing conditions to get rid of dynamic linking altogether.
Cross platform implications of the investigation results for dynamic linking.
Interposing my malloc on mac.